How Much to Charge for Leads: Margin Strategy by Vertical (2026)
How much margin should you make on leads? Benchmarks by vertical, agency math, and how to use distribution software to protect your margin in 2026.

Rafael Hernandez
Founder & CEO
Ex-Microsoft SWE · $10M+ PPL ad spend
I hope you enjoy reading this blog post. If you want to try Lead Distro AI for free, click here.
Author: Rafael Hernandez | Founder & CEO of Lead Distro AI
Last Updated: May 26, 2026
Most lead sellers set their price by gut feel or by copying a competitor. That leaves real money on the table. The honest benchmark for how much to charge for leads is a 40-65% gross margin on your distribution volume: your sell price minus your cost to acquire and deliver the lead, divided by your sell price. In practice, that means if you pay $60 to generate an MVA lead, you should be selling it for $100-171. If your margin is below 30%, you cannot absorb chargebacks and operational costs. Above 70%, you are likely underpricing to publishers or overpricing to buyers. What falls between those guardrails varies significantly by vertical, lead type, and whether you are selling exclusive or shared inventory.
Start your free 7-day trial of Lead Distro AI and get real-time P&L data that tells you your actual margin per campaign.
Key Takeaways
- The industry standard gross margin is 40-65% for lead sellers and pay-per-lead agencies. Below 30% is the chargeback danger zone.
- MVA/PI leads carry the highest margins: sellers typically pay $60-120 to generate and sell for $150-400, yielding 45-70% margin.
- Insurance leads run tighter: 30-50% is common, with heavy competition compressing margins below 40% in auto insurance.
- Solar and home services land in the middle: 40-60% gross margin is achievable with good buyer network depth.
- Mortgage margin depends on the rate environment: 35-55% in purchase cycles, compressing to 25-40% during refinance booms when buyers have more alternatives.
- Distribution method is the biggest lever on margin: ping post yields 30-75% more revenue per lead than fixed pricing in high-value verticals.
- Route leads to the highest-paying buyer first using a waterfall or priority distribution. The sequence of buyer selection is margin in disguise.
What "Margin" Means for a Lead Seller
Before the benchmarks, get the math right. Lead margin is not markup. Markup is the dollar amount you add on top of your cost. Margin is the percentage of revenue that is profit.
Lead Seller Margin Formula:
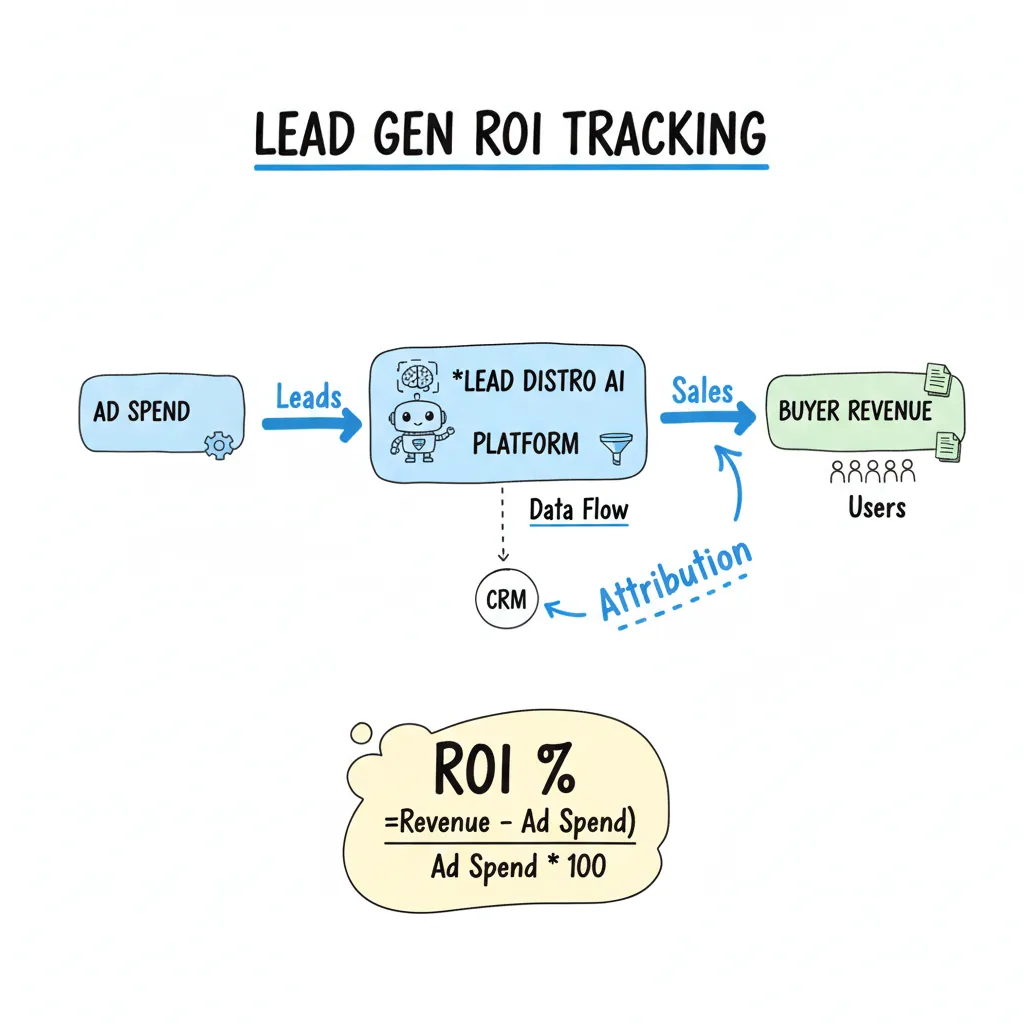
Gross Margin % = (Sell Price - Acquisition Cost) / Sell Price × 100
If you pay $80 to acquire a solar lead and sell it for $140:
Gross Margin = ($140 - $80) / $140 = 42.9%
Your acquisition cost includes media spend (Facebook, Google, native), lead gen overhead, data verification fees, and platform costs (your distribution software subscription). Divide platform cost by monthly lead volume to get a per-lead platform cost. A $297/month platform distributing 500 leads/month adds $0.60 per lead to your cost, which is negligible. At 50 leads/month it adds $5.98, which is material.
The distinction matters because buyers negotiate in dollar amounts but your business survives on percentages. A buyer who wants a $10 price reduction on a $100 lead is asking you to give up 25% of a 40% margin, not just 10%.
Margin Benchmarks by Vertical (2026)
These benchmarks are based on operator-reported data from lead generation forums, agency owner communities, and direct observation running PPL campaigns. They represent achievable ranges, not guarantees. Your actual margin depends on your traffic source quality, buyer network depth, and distribution method.
| Vertical | Typical Acquisition Cost | Sell Price Range | Gross Margin |
|---|---|---|---|
| MVA / Personal Injury | $60-120 | $150-400 | 45-70% |
| Workers' Compensation | $30-70 | $80-200 | 40-65% |
| Mass Tort (active litigation) | $80-150 | $200-600 | 45-75% |
| Health Insurance (ACA) | $10-20 | $25-60 | 40-55% |
| Medicare Advantage | $15-30 | $40-100 | 45-60% |
| Auto Insurance | $6-14 | $12-35 | 35-50% |
| Mortgage (purchase) | $15-30 | $35-90 | 45-60% |
| Mortgage (refinance) | $12-25 | $20-60 | 30-50% |
| Solar (residential) | $25-55 | $60-150 | 45-60% |
| Home Services (HVAC) | $10-22 | $22-60 | 40-55% |
| Home Services (roofing) | $15-35 | $40-100 | 45-60% |
Margins reflect shared lead sales. Exclusive leads typically yield 10-20 percentage points higher margin because sell price is 2-4x the shared rate while acquisition cost is the same.
The existing guide on how to price leads by vertical covers the sell-price benchmarks in detail. This post focuses on the margin mechanics behind those prices: what acquisition costs to expect, when to hold versus sell, and how to use your distribution infrastructure to defend the margin floor.
Agency Math: The Full P&L Stack
The gross margin number only tells part of the story. To know whether your lead operation is actually profitable, you need to account for the full cost stack.
Here is the unit economics model for a typical shared-lead operation:
| Cost Line Item | Per-Lead Cost |
|---|---|
| Media / traffic acquisition | $65.00 |
| Data verification (phone, email) | $0.80 |
| TCPA compliance (TrustedForm, Jornaya) | $0.15 |
| Distribution platform (prorated) | $0.60 |
| Payment processing (2.9% of sell price) | $3.19 |
| Chargeback reserve (5% of sell price) | $5.50 |
| Total fully-loaded cost | $75.24 |
| Sell price (shared, PI vertical) | $110.00 |
| Net margin after all costs | $34.76 (31.6%) |
Most lead sellers only look at the media cost line and declare a margin. The real margin is 8-15 percentage points lower once compliance, processing, chargebacks, and platform costs are included. At 31.6% net, this operation survives. At 20%, it does not. If a buyer pays you a lump sum for a media buy, the Lead Distro AI Media Buy tracker measures that true margin against full funnel cost while the buy is still live.
The chargeback reserve is the most underestimated cost line. If your buyer returns 8% of leads as uncontactable or out-of-scope, that is not a rounding error. On $110/lead at 8% return rate across 500 leads per month, you are eating $4,400 in monthly returns. lead scoring reduces chargeback rates by flagging low-quality leads before delivery, protecting this line item directly.
When to Hold Leads vs Sell at Market Rate
Not every lead should go out the door at whatever price the first buyer offers. Three situations call for holding:
1. Buyer inventory tightness. If your primary buyer for a vertical is at cap and your backup buyer pays 30% less, the calculation is whether the lead depreciates faster than the price difference. MVA leads hold value for 24-48 hours. Insurance leads for ACA enrollment have a hard deadline (OEP/AEP windows). Aged MVA leads at 72 hours are worth 50-60% of fresh-lead price.
2. Exclusive upsell opportunity. A lead going to three shared buyers at $90 each generates $90 for you. If one buyer has an exclusive program at $250, and the lead qualifies, the exclusive sale is the better outcome. Priority distribution lets you route to the exclusive buyer first, then fall through to shared buyers if the exclusive buyer rejects or is at cap.
3. Quality scoring above threshold. Leads with score above 80 (indicating high contact probability and intent match) are worth holding for premium placement. Delivering a 90-score lead to a low-value shared slot is the equivalent of selling prime beef at commodity prices. Set your distribution rules to route high-score leads to premium buyers before the default shared pool.
The practical implication: your distribution logic is your margin strategy. How you route is as important as what you charge.
How Distribution Software Protects Your Margin
The biggest margin mistake in lead generation is treating all buyers the same and routing on a simple round robin. This approach averages your buyer pricing down to the median instead of capturing the ceiling.
Three distribution patterns that preserve margin:
Priority / Waterfall Routing
Set buyers in ranked order. The highest-paying buyer gets first crack at every lead. If they reject (out of cap, filter mismatch, wrong state), the lead falls to the next buyer. Your margin floor is protected because you always start with the best price.
The Lead Distro AI priority distribution method supports simultaneous cap tracking and filter evaluation, so a rejected lead routes in under 200ms. A buyer being at daily cap should not cost you margin on their unsatisfied leads.
Ping Post Real-Time Bidding
Instead of setting a fixed price per buyer, ping post lets buyers bid on each lead in real time. You set a floor price (the minimum you will accept) and the market sets the price above that floor. In high-competition verticals like MVA and Medicare Advantage, ping post yields 30-75% more revenue per lead than fixed pricing because buyers outbid each other for high-quality inventory.
The margin protection here is the floor price. Set it at your fully-loaded cost plus your minimum acceptable margin (typically cost + 30%). Any lead that clears the floor sells. Leads that do not clear go to a fallback buyer at a pre-negotiated rate. Use the lead pricing calculator to model your floor price at different margin targets. The ping post guide covers the mechanics in depth.
Weighted Distribution with Margin-Based Weights
If you prefer fixed pricing over auctions, weighted distribution lets you send a higher percentage of leads to your best-paying buyers. A buyer paying $150/lead gets 50% of your volume; a buyer paying $100/lead gets 30%; a buyer paying $75/lead gets 20%. Your blended revenue per lead increases without touching prices.
Adjust weights monthly using your P&L data. Buyers consistently accepting and paying quickly deserve higher weights. Buyers with high return rates or slow payment should have their weights reduced, which nudges them toward better behavior without a confrontational pricing conversation.
Bidding Strategy for Ping Post Sellers
If you run a ping post operation, your floor price strategy determines your margin floor and your fill rate. These are in tension: a higher floor protects margin but reduces fill rate; a lower floor increases fill rate but erodes margin.
The optimal floor price strategy by vertical:
- MVA/PI: Set floor at 60% of your average exclusive sell price. In a $200 exclusive market, floor at $120. This captures premium bids while ensuring you do not give away high-quality leads.
- Insurance: Floor at 50% of market exclusive rate. Insurance buyers are more price-sensitive and fill rates matter more because lead freshness degrades quickly during enrollment windows.
- Solar and Home Services: Floor at 55-65% of exclusive rate. Buyer pools in these verticals are shallower, so a slightly lower floor improves fill rate without significant margin sacrifice.
- Mortgage: Floor pricing should vary with the rate environment. In a rising-rate refinance slowdown, buyer demand decreases and floor prices should compress 15-25% to maintain fill rates.
Track your bid acceptance rate per buyer. Buyers consistently beating your floor by 20%+ are your margin ceiling anchors. Buyers that regularly bid at or just above floor are candidates for renegotiation or replacement. Real-time P&L reporting in Lead Distro AI surfaces per-buyer margin so you can see this data without manually pulling reports.
Protecting Margin at Scale
Margin compression is natural as you scale. More volume means more supplier relationships, more buyer dependencies, and more operational overhead. Here are the three points where agencies most often lose margin as they grow:
Chargeback rate creep. As you add new traffic sources to meet volume demands, quality often drops. A 5% chargeback rate at 200 leads/month costs $1,100 at $110/lead. The same rate at 2,000 leads/month costs $11,000. Lead scoring at the point of intake catches quality drops before they become P&L events. Set a quality threshold below which leads are held from your premium buyers and redirected to lower-tier buyers or discarded.
Buyer concentration risk. If one buyer takes 60%+ of your volume, they will eventually use that concentration to negotiate price reductions. A healthy buyer pool has no single buyer above 30-35% of your volume. This is not just business risk mitigation; it is margin protection. When your top buyer knows you have three other qualified buyers ready to absorb that volume, your negotiating position is stronger.
Platform cost dilution. Distribution platform costs are mostly fixed or volume-tiered. As your volume grows, the per-lead platform cost drops. Use this as margin expansion rather than re-pricing leads downward. The platform is the one cost input that scales favorably with volume.
Frequently Asked Questions
What gross margin should a lead seller target?
A healthy lead seller targets 40-65% gross margin, which covers acquisition cost, compliance, platform overhead, and chargebacks while leaving meaningful net profit. Below 30% gross margin, a single bad month of chargebacks or a buyer going silent can make the business unprofitable. The 40-65% range is based on operator-reported benchmarks from PPL agency communities and aligns with MarketingCharts data showing lead generation as a 50-70% gross margin business for well-run operations.
How is lead margin different from lead markup?
Margin and markup are calculated differently and lead to different pricing decisions. Markup is the dollar or percentage amount added to cost: a $60 lead with 50% markup sells for $90. Margin is the profit as a percentage of revenue: that same sale has a 33% gross margin. When buyers negotiate, they think in dollar reductions. You should think in margin percentages. A $10 concession on a $90 lead is an 11% revenue reduction but a 33% margin reduction if your cost is $60.
Should I use fixed pricing or ping post to protect my margin?
Ping post protects margin better in high-value, competitive verticals (MVA, Medicare Advantage, mortgage) where buyers actively compete for quality inventory. Fixed pricing is simpler and more predictable, which makes it the right choice in lower-volume verticals or when your buyer pool is too small to generate meaningful auction competition. A buyer pool of three is not an auction; it is a negotiation. You typically need at least six active buyers for ping post to yield better revenue than fixed pricing.
How do chargebacks affect lead margin?
Chargebacks are the most direct margin hit in lead generation. A 10% chargeback rate on leads sold at $110 costs $11 per lead delivered, which is often 25-35% of your gross margin on that lead. Lead scoring reduces chargebacks by filtering out low-quality contacts before delivery. Most lead operations running lead scoring report chargeback rates of 3-6% versus the 10-15% common in unscored operations. That difference is often the gap between a profitable and unprofitable month.
How often should I review my lead margin by vertical?
Review margin by vertical monthly, and by buyer weekly. Monthly vertical reviews catch slow-moving shifts in acquisition cost (CPL from your traffic sources) or buyer pricing pressure. Weekly buyer reviews catch individual buyer behavior changes: return rate spikes, payment delays, or sudden cap reductions that signal a buyer is reducing their commitment. Lead Distro AI's real-time analytics surface per-buyer P&L continuously so the weekly review is a 15-minute dashboard check rather than a spreadsheet exercise.
What is the minimum margin needed to run a sustainable lead business?
The minimum viable gross margin for a sustainable lead operation is 30%, assuming you have low chargeback rates (under 5%) and lean operations. In practice, most successful agencies target 45%+ gross margin because it provides a buffer for the inevitable bad months: a traffic source algorithm change that triples CPL, a buyer going silent mid-month, or a compliance event that triggers returns. The lead volume estimator lets you model sustainability at different margin levels and volumes.
The Bottom Line
How much margin to charge on leads comes down to one number: your fully-loaded cost per lead, including media, verification, compliance, platform, processing, and a chargeback reserve. Start from that number, not from competitor pricing. Target 40-65% gross margin, protect your floor through your distribution routing logic, and route high-quality inventory to premium buyers before it falls to default shared buyers.
The lead sellers who defend margin best are not the ones who charge the highest prices. They are the ones who know their cost structure down to the cent and use their distribution software to enforce the economics in real time.
Try Lead Distro AI free for 7 days and see your per-campaign, per-buyer margin in a single dashboard. Credit card required; cancel anytime during the trial.
Use the lead pricing calculator to model your target margin at any acquisition cost and sell price, or the lead volume estimator to see how your margin holds as volume scales.
About the Author
Founder & CEO of Lead Distro AI & Great Marketing AI
UC Berkeley graduate and former software engineer at Microsoft. Rafael built Lead Distro AI after managing over $10M in ad spend for performance marketing agencies (pay-per-lead and pay-per-call), including running campaigns for Neil Patel. He combines deep software engineering expertise with hands-on performance marketing experience to build tools that help these agencies scale profitably.
About Lead Distro AI
Lead Distro AI: AI-Powered Routing for Your Leads, Calls, and Appointments
The modern platform for pay-per-lead and pay-per-call agencies. Route, score, and deliver leads with AI-powered automation and real-time P&L tracking. Built for performance marketing agencies and lead buyers across legal, insurance, mortgage, solar, and home services verticals.
4 Distribution Methods
Waterfall, Round Robin, Weighted, Ping-Post
Ping-Post Auctions
Real-time bidding with sub-second routing
Real-Time P&L Reporting
Track revenue, costs, and profit per campaign
Call Tracking
Assign tracking numbers, record calls, and attribute conversions
Lead Scoring
Score every lead before routing to maximize conversion
Partner Portal
Self-serve dashboard for buyers to track leads